About SciFig
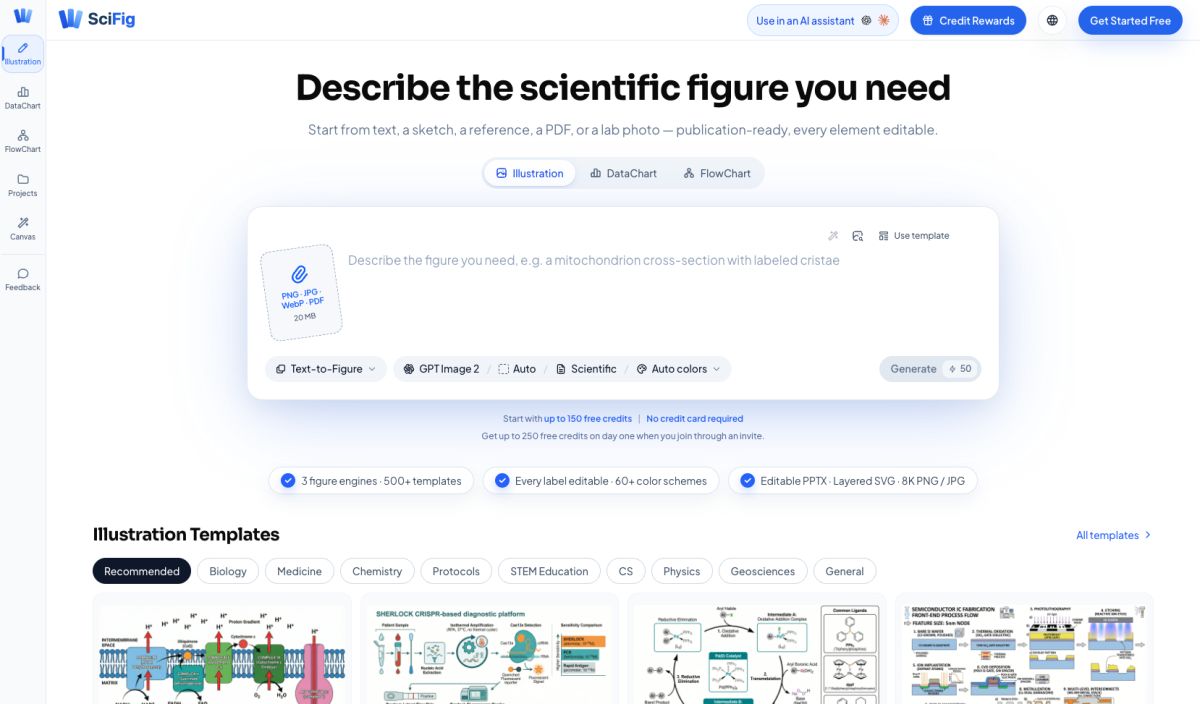
SciFig helps researchers create scientific illustrations, data charts and flowcharts for papers, presentations and research communication.
Use an online workspace to start a visual from text, sketches, reference images, PDF documents or data files, depending on the workflow. Refine the output to fit your research. DataChart and FlowChart support editable SVG exports, so visual elements can be adjusted after generation. SciFig offers a free plan and paid options for additional usage.